Studies in Cosmic Ray Muons
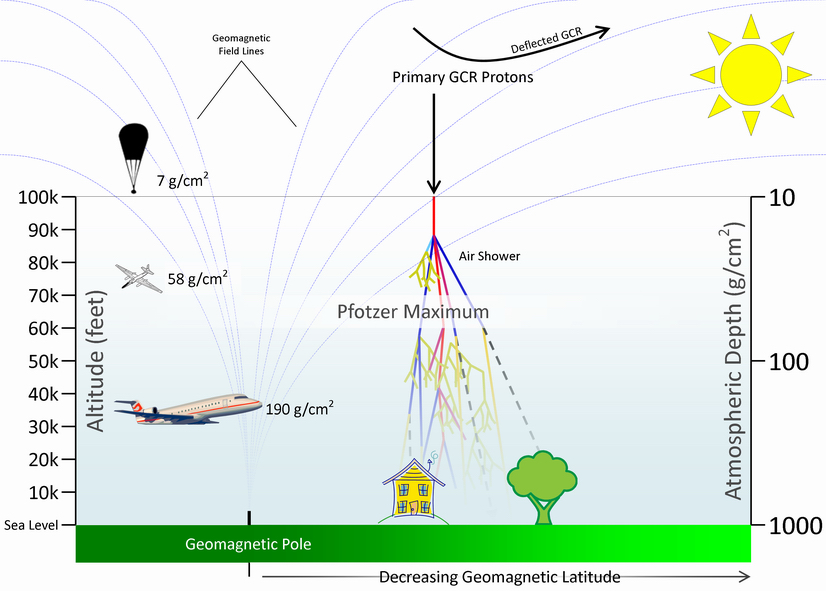
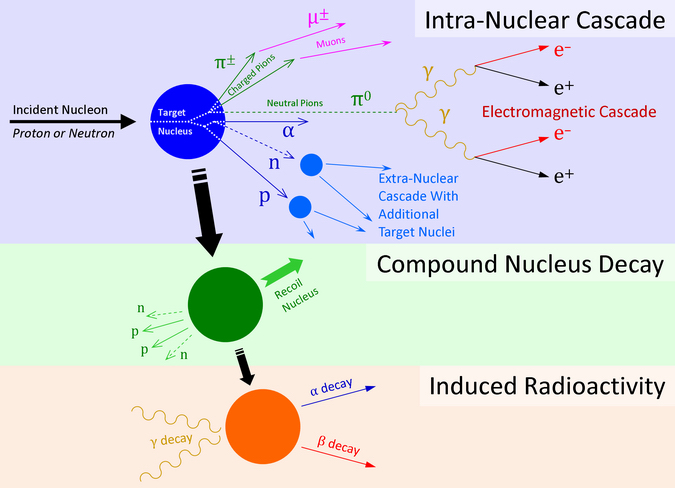
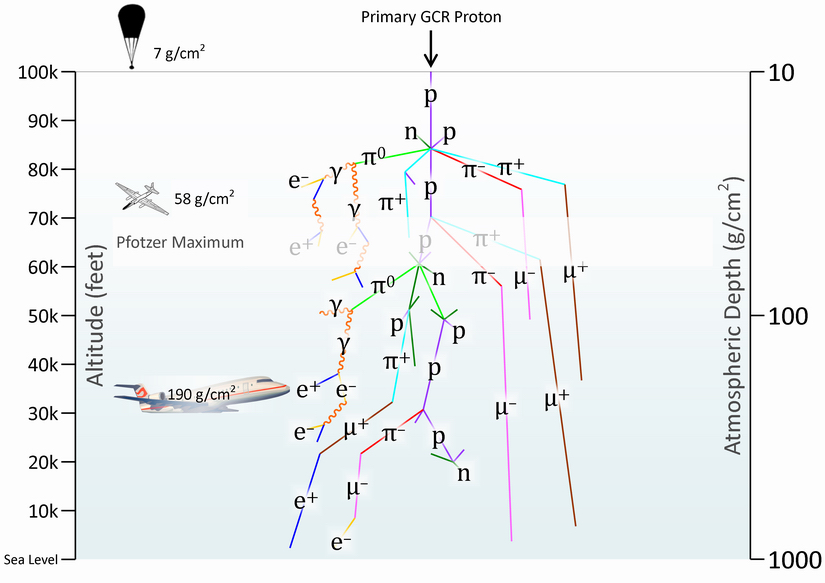
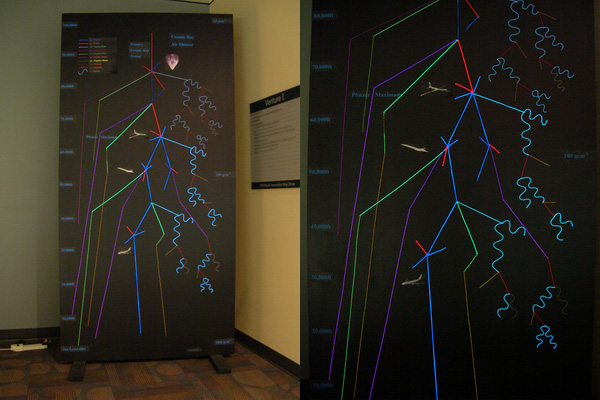
Earth’s atmosphere acts as a shield from galactic cosmic rays (GCRs) which are constantly bombarding our world from deep space. The minimum energy of an incident GCR needed for sea level detection of muons is about 100 MeV, which are highly accessible measurement-wise. The radiation environment within the Earth’s atmosphere is complex because it is subject to spatial and temporal variations. This high altitude environment, shown in Figure 1, is composed almost entirely of secondary particles. These secondary particles are the result of air showers or particle cascades initiated when primary cosmic rays interact with the constituent nuclei of the atmosphere. The usual scenario, illustrated in Figure 2, involves the interaction of an incident proton or neutron with a target oxygen or nitrogen nucleus in the atmosphere. The incident nucleon is commonly a primary GCR proton, but a secondary proton or neutron resulting from an earlier nuclear interaction within the atmosphere may also be the case. A target fragmentation event can result in a number of different scenarios depending on the kinetic energy of the incident nucleon and the proximity of the interaction. An understanding of the radiation environment at high altitudes can be obtained by considering the sources of cosmic radiation and the different physical processes that affect this radiation. For high altitudes one must first consider propagation of this radiation field through the Earth’s magnetosphere before taking into account its propagation in the atmosphere. Figure 3 illustrates the structure of an air shower in the atmosphere initiated by a high-energy proton.
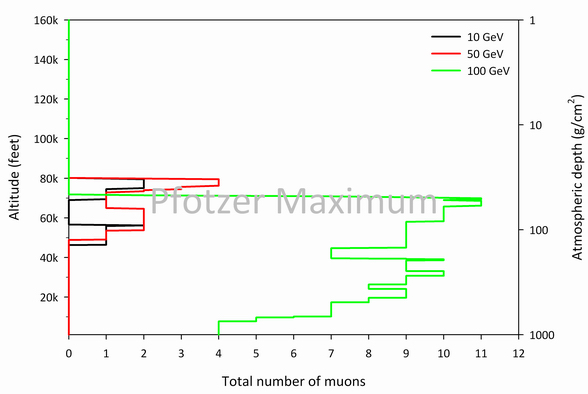
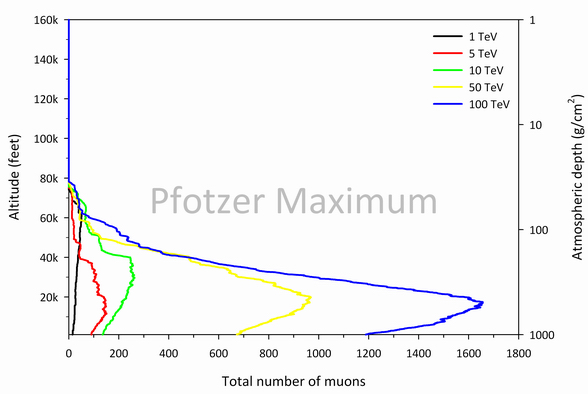
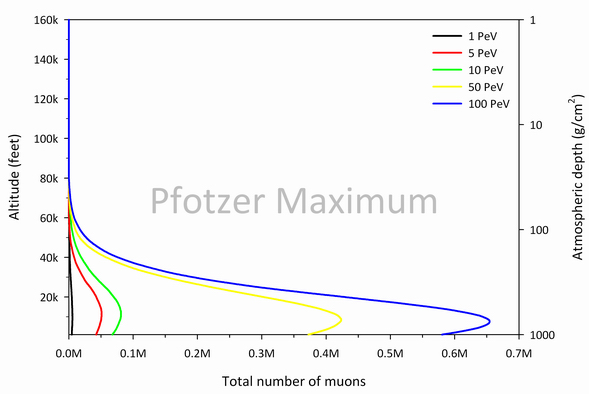
Figures 4, 5, and 6 display the total muon count as calculated using the Monte Carlo transport code CORSIKA as a function of depth and altitude for various proton energy ranges [1]. This step was taken in order to answer the question: What primary proton energies are responsible for most of the muons detected by the muon telescope? These plots show the simulated total muon production (μ+ + μ–) in the Earth’s atmosphere for the GeV, TeV, and PeV incident GCR proton energy regimes. Figure 4 shows a peak total muon count corresponding to the Pfotzer maximum (about 58 g/cm2 or 66,000 feet) for the 100 GeV proton. However, this is not the case for high incident proton energies (Figures 5 and 6), where peak total muon counts occur at significantly lower altitudes. This suggests that, while incident protons with lower kinetic energies in the GeV range initiate air showers that produce far fewer muons, they are much more frequent and hence are responsible for the muonic component of the Pfotzer maximum.
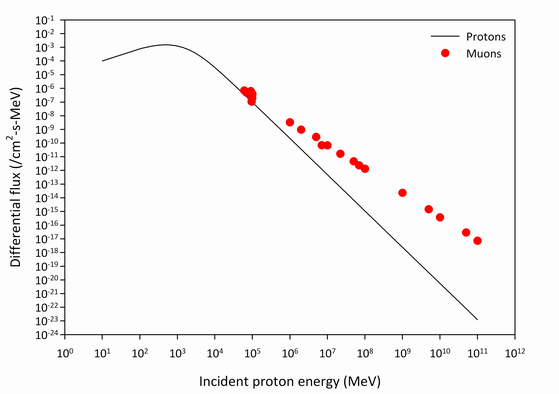
Figure 7 shows a comparison of the results depicted in Figures 4-6, where the individual data points in Figure 7 are the total number of muons to reach sea level. This trend is shown alongside the result of a proton energy spectrum model at the top of the atmosphere [2]. A comparison of these data reveals that frequent lower energy protons initiating air showers at the top of the Earth’s atmosphere produce a greater flux of muons that reach sea level. This is in contrast to much higher energy protons that occur less frequently but produce large quantities of muons. This rarity of high energy protons translates into a reduced flux of muons that can be detected at sea level. In other words, while roughly 100 GeV protons create far fewer muons than higher energy protons, they are so much more numerous that they lead to the majority of secondary muons detected near sea level. An air shower is initiated by a high energy proton at the top of the atmosphere. The population of minimally-ionizing, long-range muons is calculated near sea level with CORSIKA.
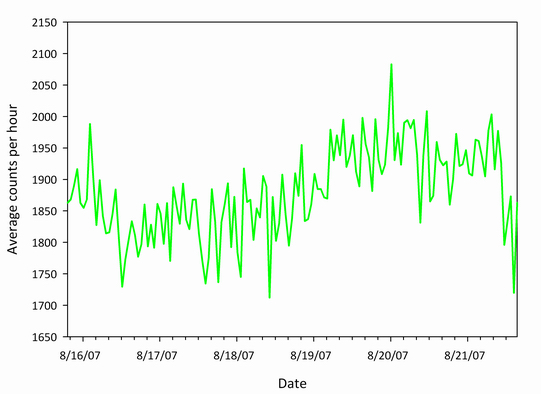
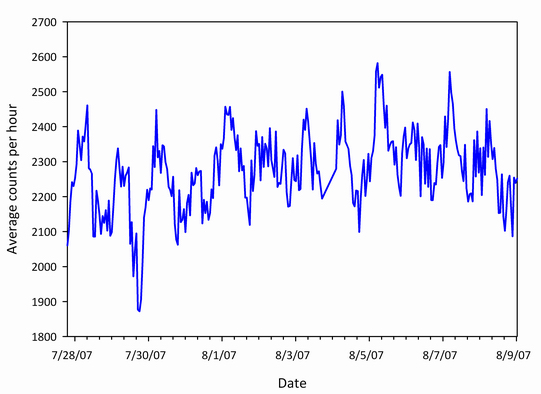
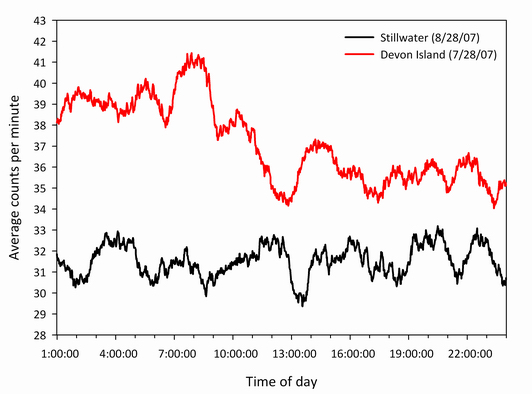
At sea level, the most abundant cosmic ray secondary particles are muons. Muons behave like massive electrons except that they are unstable and have a mean lifetime of approximately 2 µs. Because of this short lifetime, the detection of air shower muons at or near sea level is an excellent demonstration of special relativity. The first observation of secondary cosmic ray muons dates back to the 1940s, when ionization chambers were used. Over time, the detection technique migrated to the use of Geiger-Müller counters, then finally to plastic scintillators. A muon detector using slabs of plastic scintillator (“paddles”) employs a coincidence technique to deduce the arrival of an ionizing muon. A muon detector utilizing two or more paddles is called a muon “telescope” because the scintillator paddles are arranged in the same way as lenses in an optical telescope. Modern muon telescopes are simple ionizing radiation detectors arranged in two or more paddles. These detector systems produce output pulses on the order of 1 ms whenever a charged particle passes through them. Since the incoming muon is traveling relativistically, and crossing the complete telescope before the electronics are able to register its passage, a simple coincidence technique must be employed in order to detect the particle. Several muon telescopes have been constructed by Carl Johnson of the OSU Radiation Physics Laboratory and have been operational since the middle of 2007. Sample total muon count rate measurements (μ+ + μ–) made by these detection systems are presented in Figures 8 and 9. The opportunity to send a portable muon detector to a high geomagnetic latitude in the summer months of 2007 enabled the collection of muon data to compare to that from the Stillwater latitude. A comparison of these data over a 24-hour period is shown in Figure 10. The higher count rate measured on Devon Island illustrates the latitude effect of a location with a higher geomagnetic latitude. A higher geomagnetic latitude, in general, corresponds to a lower vertical cutoff rigidity, effectively reducing the protection the Earth’s magnetic field offers. Physically this lowered cutoff translates into a reduced momentum-per-unit-charge requirement of a primary cosmic ray to enter the Earth’s atmosphere and initiate an air shower, creating secondary muons as a result.
References
-
[1] Heck, D., Knapp, J., Capdevielle, J.N., Schatz, G., and Thouw, T. (1998). “CORSIKA: A Monte Carlo Code to Simulate Extensive Air Showers,” FZKA 6019.
-
[2] Reedy, R.C. (1987). “Nuclide Production by Primary Cosmic-Ray Protons,” Journal of Geophysical Research 92, E697.

